UK inflation is now built from 300 million supermarket scans
Key Points
- The ONS uses supermarket scanner data for about 50% of the UK grocery basket.
- It draws roughly 300 million price points a month from over a billion product units.
- The change started with the February 2026 index, published 25 March 2026.
- Scanner data lowered the February headline rates by 0.1 percentage points.
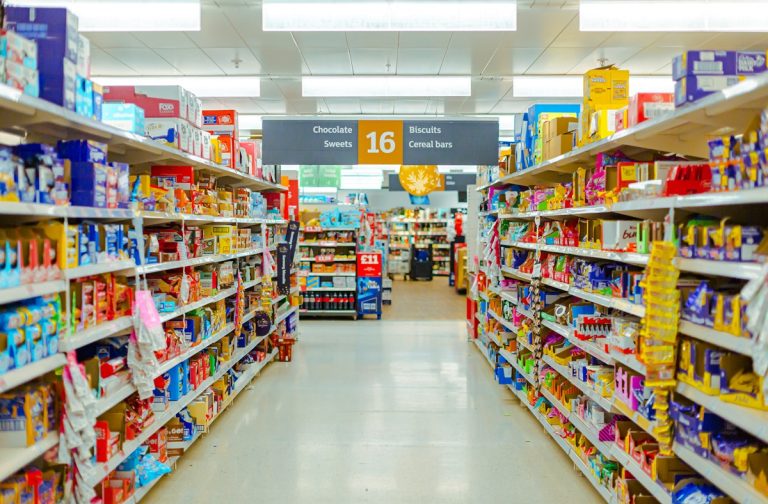
The Office for National Statistics now compiles around half of the UK’s grocery inflation data from roughly 300 million price points pulled from supermarket checkouts and online sales each month.
This system replaces the tens of thousands of prices its collectors once recorded by hand.
The switch to scanner data took effect with the February 2026 index, published on 25 March 2026, and covers approximately 50% of the grocery market, according to the ONS Consumer price inflation bulletin.
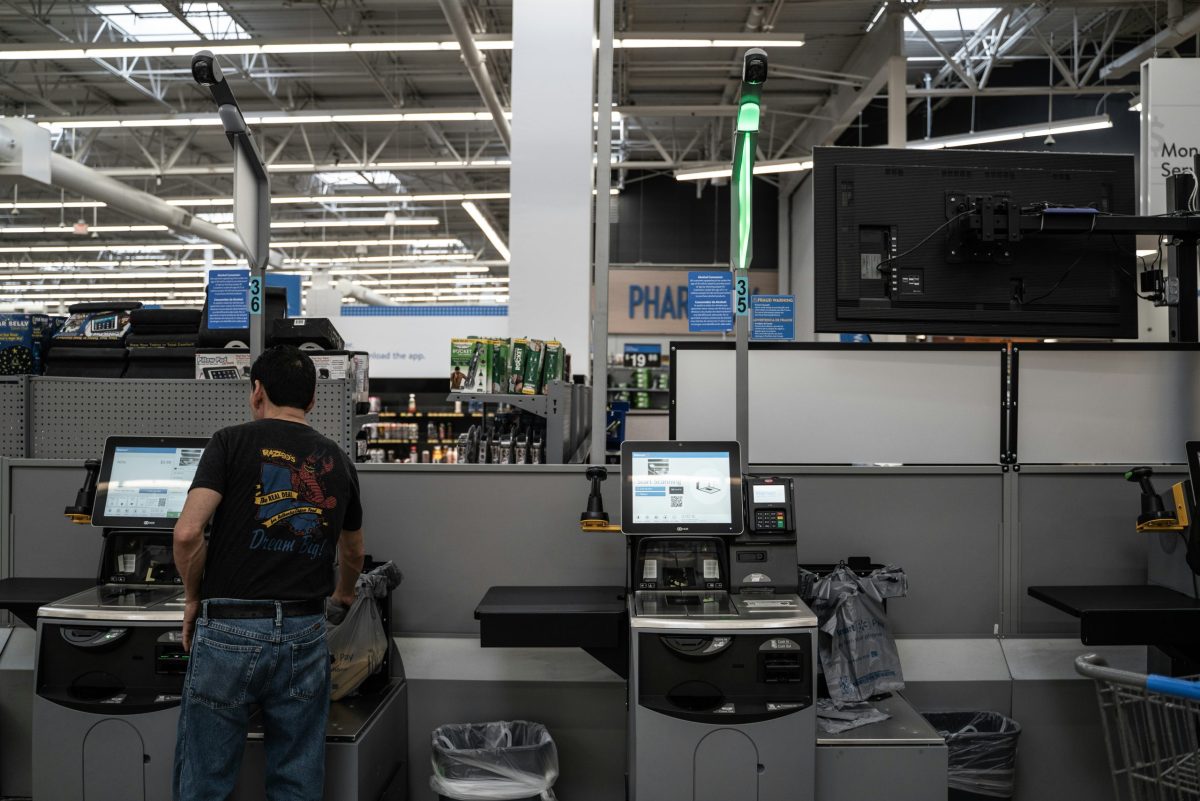
The data is drawn directly from supermarket tills and online baskets, capturing sales of over a billion units of products a month. For the remaining half of the grocery market, the ONS continues to collect prices manually in-store and online.
Under the previous method, ONS price collectors gathered around 25,000 grocery prices a month from shops around the country.
The scanner feed replaces that sample with roughly 300 million price points for the categories it now covers, a shift the ONS describes in its impact analysis on the transformation of UK consumer price statistics.
The change measurably altered the headline figures. The ONS produced February 2026 rates using only locally collected grocery data for comparison.
On that basis, the Consumer Prices Index including owner occupiers’ housing costs (CPIH) rose by 3.3% in the year to February, and the Consumer Prices Index (CPI) rose by 3.1%. The official rates, produced with scanner data, came in at 3.2% and 3.0% respectively, 0.1 percentage points lower in each case.
The new data source feeds beyond the headline indices. The ONS incorporated scanner data into the Retail Prices Index (RPI) from the March 2026 release, following the Bank of England’s response to the proposed changes required under the Statistics and Registration Service Act 2007.

It was also built into the Household Costs Indices (HCIs), published on 28 May 2026, which included scanner data for the first time.
The move has forced a change to what the ONS can publish at a granular level. Because of data-sharing agreements with retailers, the ONS can no longer release the individual price quote data for food and non-alcoholic beverages, alcohol and tobacco in its consumption segment indices and price quotes dataset.
In its place, the ONS has begun publishing regional consumption segment indices and weights, along with counts of manually collected indicator marker codes such as sales and recoveries.
The first of these new outputs appeared in March 2026, with further outputs scheduled for summer 2026.
The methodology underpinning the change rests on a reclassification introduced with the February 2025 indices, when goods and services were allocated into “consumption segments” for different categories of expenditure.
Some segments map to a single tracked item, while others were set up to absorb far more, anticipating the richer scanner feed.