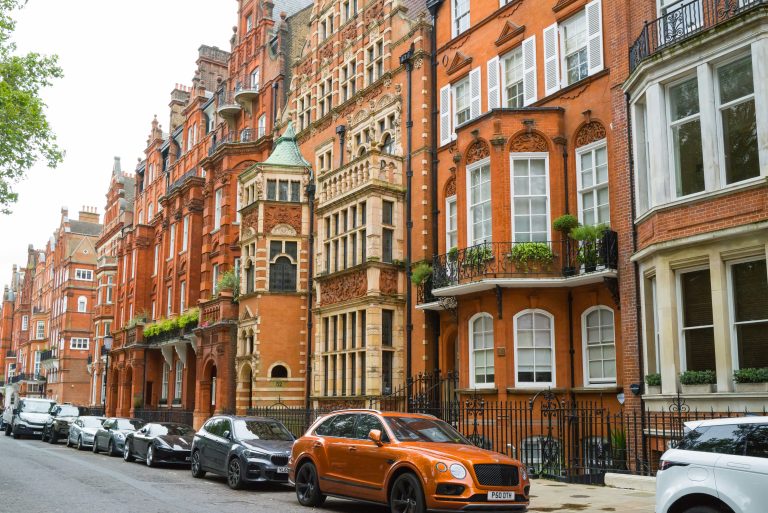
London homes are worth £14,000 less than they were a year ago


Key Points
- The average London home fell 2.5% in value over the year to June 2026, to £554,000.
- London was the only English region to record an annual price fall.
- London flats and maisonettes dropped 4.7% to £431,000, the steepest fall by property type.
- The North West led England with annual growth of 4.7%, taking its average to £220,000.
- UK-wide growth slowed to 2%, down from a revised 3% in the 12 months to May 2026.
The average London home costs £554,000, an average of £14,000 less than the same time last year.
London prices fell 2.5% in the year to June 2026, the only annual drop of any English region, even as they rose 1% between May and June. HM Land Registry published the figures on Wednesday (19 August) as part of the UK House Price Index.
Flats and maisonettes drove the fall, dropping 4.7% to an average £431,000 from £452,000 a year earlier.
Detached homes slipped 0.7% to £1,162,000 and terraced homes edged down 0.3% to £641,000. Semi-detached properties were the only type to gain, rising 0.6% to £722,000.
| Property type | June 2026 | June 2025 | Change % |
|---|---|---|---|
| Detached | £1,162,000 | £1,171,000 | -0.7 |
| Semi-detached | £722,000 | £717,000 | 0.6 |
| Terraced | £641,000 | £642,000 | -0.3 |
| Flat/maisonette | £431,000 | £452,000 | -4.7 |
| All | £554,000 | £568,000 | -2.5 |
First-time buyers in London paid an average £472,000, down 2.8% on a year earlier. Cash buyers recorded the sharpest annual fall at 4%, taking their average purchase to £589,000, while mortgaged buyers paid £547,000, down 2.1%. Former owner occupiers paid £697,000, a fall of 1.9%.
| Transaction type | Average price June 2026 | Annual change % | Monthly change % |
|---|---|---|---|
| Cash | £589,000 | -4 | 1.4 |
| Mortgage | £547,000 | -2.1 | 0.9 |
| First-time buyer | £472,000 | -2.8 | 0.8 |
| Former owner occupier | £697,000 | -1.9 | 1.3 |
Prices outside London
The North West recorded the strongest annual growth in England at 4.7%, taking the average property to £220,000. The North East rose 4.3% to £166,000 and Yorkshire and the Humber gained 3.6% to £208,000. The South East managed 0.3% growth to £380,000, the weakest rise outside London, and the East Midlands recorded the biggest monthly fall at 0.7%, leaving its average at £240,000.
Across England, prices rose 1.8% over the year to an average £293,000. Flats fell 2.3% to £219,000, while semi-detached homes rose 3.2% to £291,000, terraced homes 2.8% to £246,000 and detached homes 2% to £475,000.
UK house prices rose 2% in the year to June 2026, down from a revised 3% in the 12 months to May, putting the average property at £272,000. Wales recorded annual growth of 1.8% to £213,000. Between May and June, UK prices rose 0.1%.
| Region | Average price June 2026 | Annual change % | Monthly change % |
|---|---|---|---|
| North West | £220,000 | 4.7 | 0.4 |
| North East | £166,000 | 4.3 | 1 |
| Yorkshire and the Humber | £208,000 | 3.6 | -0.6 |
| West Midlands | £251,000 | 2.6 | 1 |
| East Midlands | £240,000 | 2.4 | -0.7 |
| South West | £305,000 | 1.9 | 0.6 |
| East of England | £339,000 | 1.1 | -0.2 |
| South East | £380,000 | 0.3 | -0.3 |
| London | £554,000 | -2.5 | 1 |
An estimated 99,000 residential properties worth £40,000 or more changed hands in June on a seasonally adjusted basis, 2.5% more than a year earlier and 0.2% fewer than in May.
The index tracks completed sales, which typically take six to eight weeks to reach completion. HM Land Registry will publish the July figures at 9:30am on Wednesday 16 September.