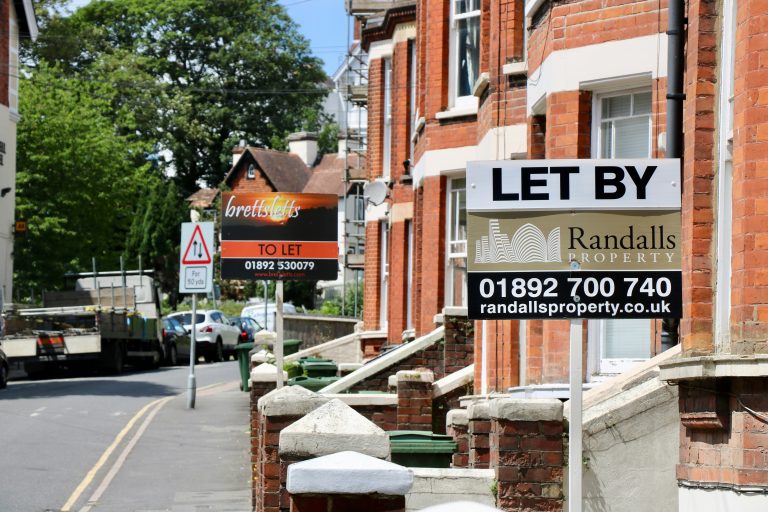
The massive price gap between social housing and private rents in London


Key Points
- Renting privately is astronomically expensive compared with renting social housing in London.
- We have broken down the average private rent and social housing rent for every borough in London.
- While they are much cheaper than private rental properties, social rents are in extremely high demand, with the number of households on waitlist for social housing often outnumbering the total number of houses available and already occupied.
- G15 has pushed for more affordable housing to be built in the capital, pointing to the positive impact of affordable renting on economic growth.
The price of renting a private home is astronomically high compared with the cost of social housing in London, highlighting the demand for affordable housing in the capital.
Social housing, or social rent homes, refers to properties owned by housing associations or local councils and provided with the goal of ensuring that everyone can live in a decent and affordable home.
These properties are rented out to those who need them for a price that is tied to local incomes. The rent formula for social housing is controlled by the government and generally leads to properties that are well below the market rate for private rentals.
This disparity is especially true in London, where rentals stretch the limits of affordability. An online map maintained by G15, a group of independent, charitable social and affordable housing organisations, shows how cheap it can be to live in the city if you are renting social housing.
Check out the full interactive map on the G15 website.
In Westminster, where G15 provides a total of 11,769 homes, the average price of a privately rented property is £3,277 per month. For social renters, the average price is £703 per month.
The disparity is even more apparent in the borough of Kensington and Chelsea, where the average private rent is £3,639 per month while the average social rent is £686.
G15 uses 2025 data to compare private and social rents in the capital, and it also tracks the number of people on a waiting list for social housing in each borough.
Below is the average private rent, average social rent, and number of households on a waiting list for social housing in each borough of London.
| Borough | Average Private Rent | Average Social Rent | Waitlist |
|---|---|---|---|
| Kensington & Chelsea | £3,683 | £686 | 2,930 |
| Westminster | £3,277 | £703 | 6,452 |
| Camden | £2,840 | £719 | 8,380 |
| Hammersmith & Fulham | £2,738 | £695 | 15,446 |
| Islington | £2,699 | £679 | 16,974 |
| Hackney | £2,534 | £639 | 7,841 |
| Wandsworth | £2,488 | £694 | 9,543 |
| Lambeth | £2,366 | £635 | 29,187 |
| Southwark | £2,358 | £653 | 13,351 |
| Tower Hamlets | £2,355 | £672 | 28,469 |
| Richmond | £2,163 | £662 | 2,880 |
| Haringey | £2,153 | £635 | 14,179 |
| Brent | £2,105 | £673 | 36,354 |
| Merton | £2,049 | £610 | 11,011 |
| Ealing | £2,033 | £682 | 7,813 |
| Hounslow | £1,870 | £664 | 4,375 |
| Greenwich | £1,865 | £632 | 25,377 |
| Barnet | £1,838 | £677 | 3,485 |
| Newham | £1,776 | £642 | 41,223 |
| Lewisham | £1,764 | £588 | 11,284 |
| Kingston | £1,736 | £694 | 1,835 |
| Waltham Forest | £1,721 | £625 | 12,463 |
| Harrow | £1,702 | £700 | 2,122 |
| Enfield | £1,698 | £648 | 6,656 |
| Redbridge | £1,659 | £659 | 7,992 |
| Bromley | £1,611 | £611 | 3,201 |
| Barking & Dagenham | £1,568 | £626 | 4,253 |
| Hillingdon | £1,521 | £659 | 3,192 |
| Sutton | £1,507 | £629 | 2,870 |
| Croydon | £1,502 | £654 | 8,559 |
| Havering | £1,478 | £623 | 2,651 |
| Bexley | £1,422 | £592 | 1,640 |
Social housing driving economic growth
The size of the waitlists for social housing and the relative unaffordability of private rentals highlights London’s need for more affordable and social housing to drive its economic growth.
Research recently published by G15 showed that Londoners who live in social housing are net contributors to the city’s economy, generating £9 for every £1 they receive in housing benefit.
Additionally, a higher proportion of social housing residents work in key occupations, including in health and social work.
“People living in London’s social housing contribute almost £28 billion to the economy every year, while social homes themselves create billions more in value by reducing pressure on our public services,” said G15 chair and Peabody chief executive Ian McDemott.
“That makes social housing one of the country’s most important economic assets. It supports the nurses, teachers, carers, transport workers, shop workers and countless others who keep our economy moving, while giving families the stability they need to thrive.”